
On December 9, U.S. EPA Region 5 held a one-day training session that provided an introduction to green chemistry and engineering basics for pollution prevention technical assistance providers. The event was also broadcast as a webinar.
Speakers and topics included:
- “P2 Hazard Reduction Fundamentals and National Metrics for Measuring
Success” — Kathy Davey, U.S. EPA, HQ - “Highlights of Module 2: U.S. EPA’s Design for the Environment Program
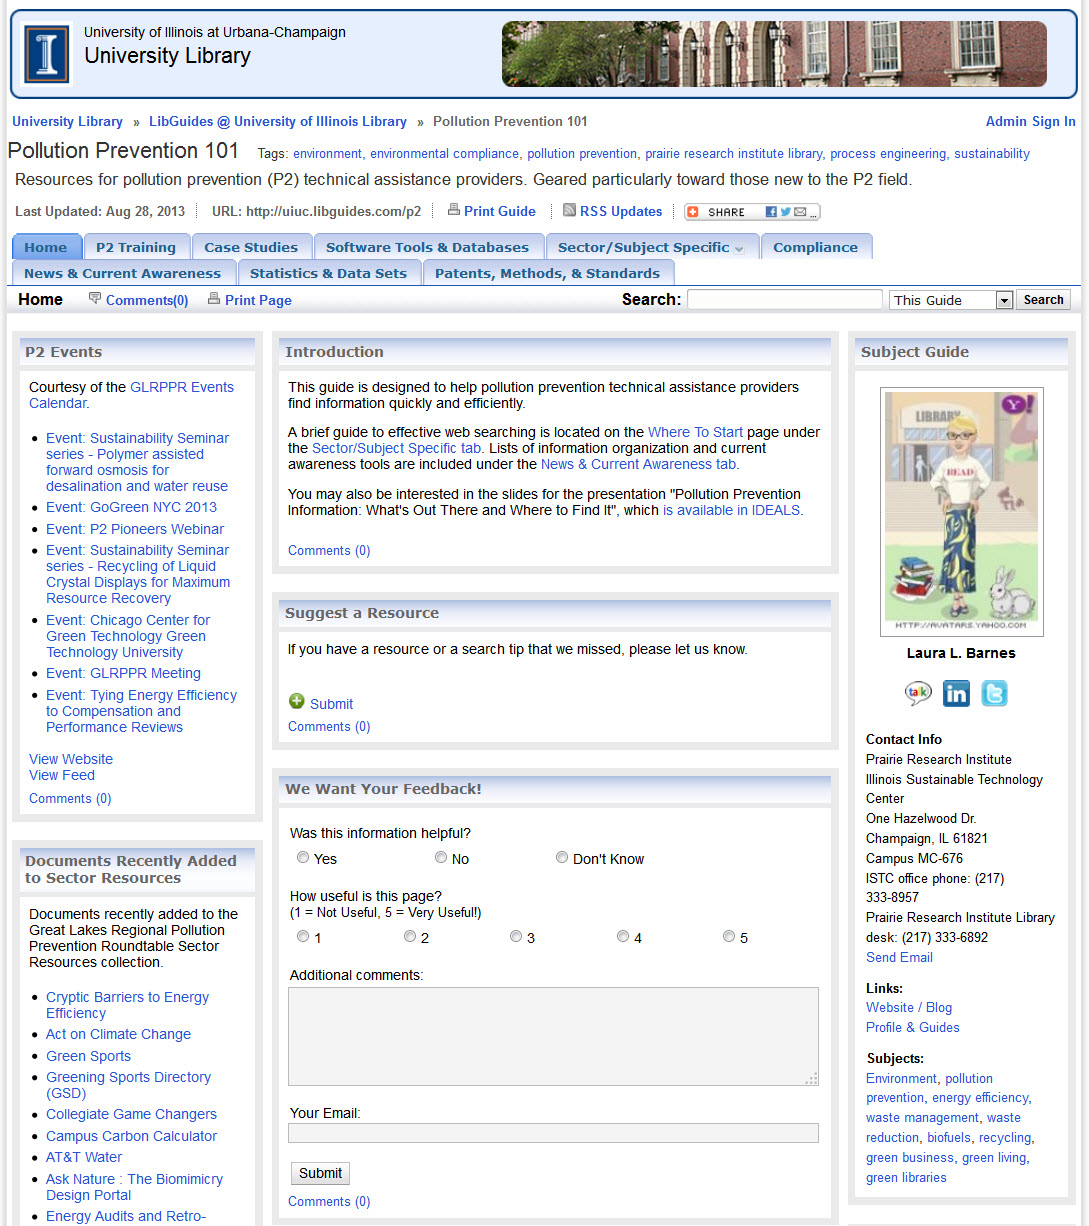
and External Resources” — Donna Twickler, U.S. EPA, Region 5 - “Using GLRPPR to Identify Hazardous Substance Reduction Resources” — Laura Barnes, Great Lakes Regional Pollution Prevention Roundtable
- “Green Industrial Performance through Waste Minimization” — Dan Marsch, Illinois Sustainable Technology Center
- “Hazardous Substance Reduction through Best Management Practices: MnTAP Case Study Examples” — Laura Babcock, Minnesota Technical Assistance Program
- “Targeting Chemicals of Concern and Industrial Sectors” — Laura Babcock, Minnesota Technical Assistance Program
- “Using the Toxics Release Inventory Pollution Prevention Data Tool” — Daniel Teitelbaum, U.S. EPA, HQ
Online modules are also being developed using this training material. They will be available in early 2014. Training materials are available from the following links:
Agenda and Overview
- Agenda: http://www2.ergweb.com/listserv/lex/m2m/EPA_R5/Agenda.pdf
- Course Overview: http://www2.ergweb.com/listserv/lex/m2m/EPA_R5/Course Overview.pdf
- Presenter Biographies: http://www2.ergweb.com/listserv/lex/m2m/EPA_R5/Presenter Bios.pdf
Presentation Slides
- Module 1: http://www2.ergweb.com/listserv/lex/m2m/EPA_R5/Module_1_full_page_slides_11-25-13.pdf
- Module 2: http://www2.ergweb.com/listserv/lex/m2m/EPA_R5/Module_2_full_page_slides_11-25-13.pdf
- Module 3: http://www2.ergweb.com/listserv/lex/m2m/EPA_R5/Module_3_full_page_slides_9-23-13.pdf
- Module 4: http://www2.ergweb.com/listserv/lex/m2m/EPA_R5/Module_4_full_page_slides_9-23-13.pdf
Module Resources
- Global Warming Potential of Substances: http://www2.ergweb.com/listserv/lex/m2m/EPA_R5/Global%20Warming%20Potential%20of%20Substances.pdf
- Alternatives to Toxics, VOCs, and Global Warming: http://www2.ergweb.com/listserv/lex/m2m/EPA_R5/Alternatives%20to%20Toxics,%20VOCs,%20and%20Global%20Warming.pdf
- Summary Matrix of Methods and Tools (Lowell Center): http://www2.ergweb.com/listserv/lex/m2m/EPA_R5/Summary%20Matrix%20of%20Methods%20and%20Tools%20(Lowell%20Center).pdf
- ChemView Tool: http://www2.ergweb.com/listserv/lex/m2m/EPA_R5/ChemView%20Tool.pdf
- ADOP2T Model: http://www2.ergweb.com/listserv/lex/m2m/EPA_R5/ADOP2T%20Model.pdf
- Using GLRPPR and P2Rx Centers (List of Links): http://www2.ergweb.com/listserv/lex/m2m/EPA_R5/Using%20GLRPPR%20and%20P2Rx%20Centers%20(List%20of%20Links).pdf
- TRI’s Pollution Prevention Data Factsheet: http://www2.ergweb.com/listserv/lex/m2m/EPA_R5/TRI’s%20Pollution%20Prevention%20Data%20factsheet.pdf
- Module 2 Design for Environment Self Study: http://www2.ergweb.com/listserv/lex/m2m/EPA_R5/Module%202_Design%20for%20Environment%20self%20study11-25-13%20(2).pdf
 ,
,  or,
or,  . In most common Web browsers, when you click these buttons, you can subscribe to the associated feed. You can also enter a feed’s web address (URL) directly into your reader’s Subscribe area. Most literature databases allow you to subscribe to topical or table of contents alerts via RSS.